![]()
![]()
![]()
![]()
![]()
![]()
![]()
![]()
|
|
|
What is the Ecocosm? Our Crisis Hypothesis The Ecocosm Paradox A Solution Method
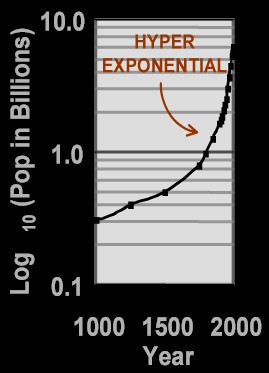
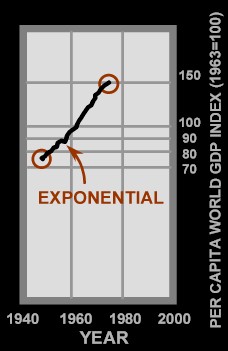
World Human Consumption equals the product of: World Human Population and Avg Human Per Capita Consumption
Both graphs shown have a vertical logarithmic scale. An exponentially shaped graph (with a steady rate of growth) appears as a straight line on a logarithmic scale. The consumption graph on the right is exponential. A hyper-exponential graph is one that has an exponential shape even on a logarithmic scale, indicating an increasing rate of growth. The world population graph on the left is an example of a hyper-exponential. The per-capita consumption graph (right) shows doubling over 30 years (1950-1980). World human population (left) is now doubling about every 35 years. Multiplying per-capita consumption by world human population gives world human consumption. This product is a compound hyper-exponential which is currently quadrupling about every 35 years. At its present rate of growth, world human consumption will increase by a factor of 16 during an average human lifetime. Sources: Average Human Per-capita Consumption graph shown above was adapted from: Parent, J. (1984). A Survey of United States and Total World Production, Proved Resources, and Remaining Recoverable Resources of Fossil Fuels and Uranium. Chicago:Institute of Gas Technology.Cipolla,C. (1974). The Economic History of World Population. Harmondsworth,Eng:Penguin,pp.92,94,103. Fey, W. R., and Lam, A. C. W.: ‘Pie in the Sky’: A System Dynamics Perspective of Sustainability, Proceedings of the 42nd Annual Conference of the International Society for the Systems Sciences, 1998.U.N. Population Div. (1994)."World Population Growth-Year 0 to Stabilization", Internet:gopher.undp.org. U.S. Bureau of the Census (1974,83,91,94,96). World Population Profile. Washington, DC:US Govt P.O. |
|
Copyright © 1999-2001 by Ecocosm Dynamics, Ltd. except where otherwise noted. All rights reserved. |